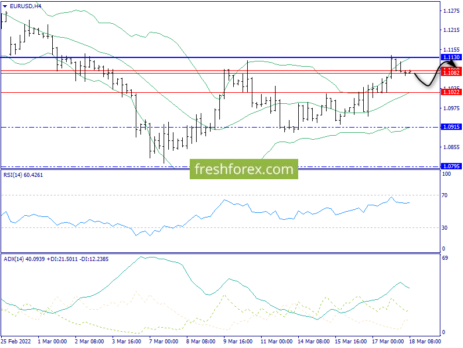
Daily chart : The pair is testing the middle band of the Bollinger (1.1082), where the big interest of sellers can be focused – two weeks ago, the lower envelope of the Bollinger was broken, which is a downward wave signal.
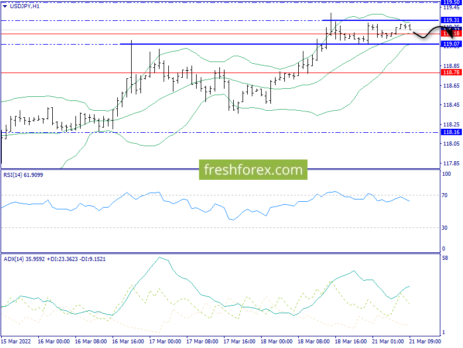
Daily chart: The fourth in a row bar outside the top envelope of the Bollinger is an important feature of a possible transition to downward correction.
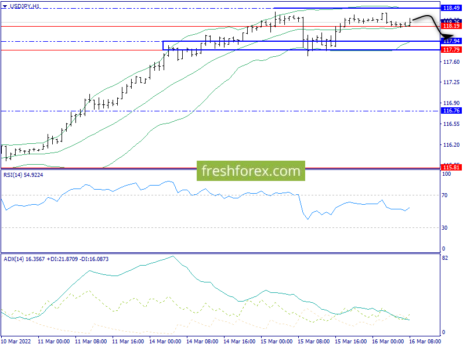
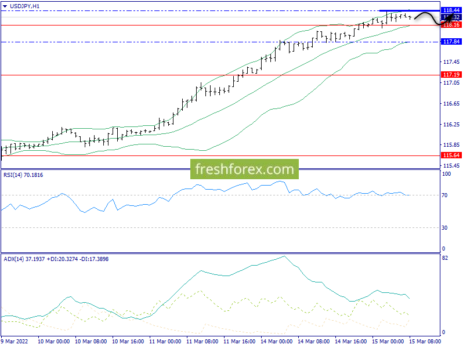
Daily chart: The third in a row bar outside the top envelope of the Bollinger, on the one hand, confirms the dominance of bulls, but, on the other, significantly increases the overbought of the market and, as a result, increases the likelihood of turning down tomorrow-day after tomorrow.