S&P500
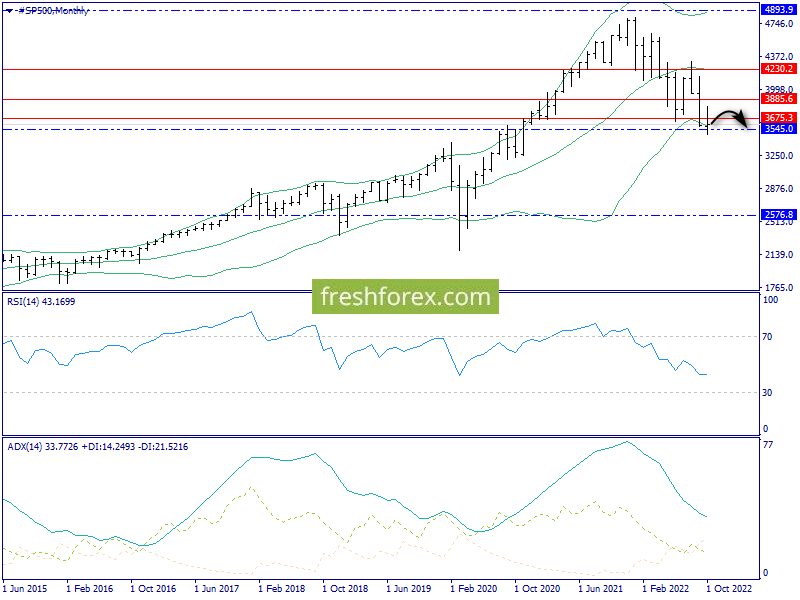
Monthly graph : Bears are trying to “win” support in zone 3545.0, but the falling potential of ADX does not help with a breakdown.
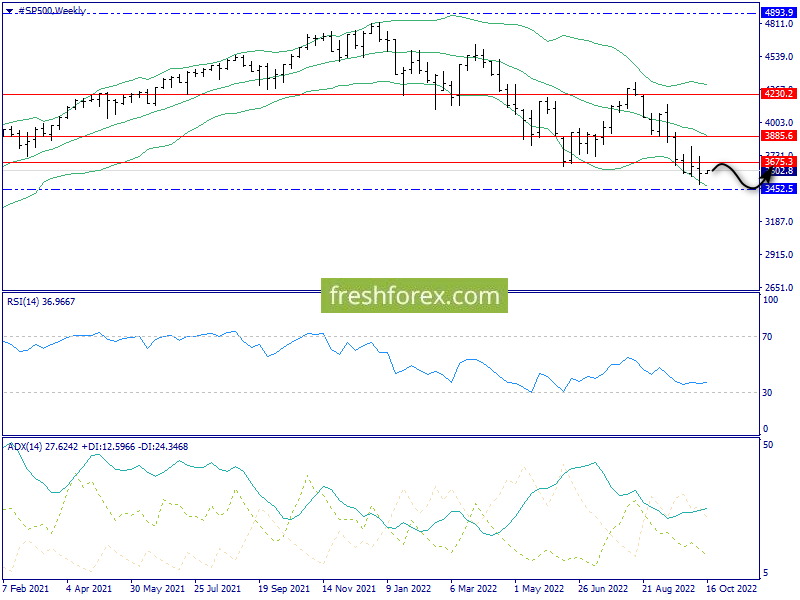
Weekly schedule : Dynamic support, which is so far the maximum possible purpose of reducing – 3452.5 (Bolinger’s lower line).
Day graph : very confident protection of the lower envelope of the Bollinger, and the equally strong resistance in the zone of the middle lane of the Bolinger. Thus, the most likely scenario of the week There is further consolidation in the range 3529.7-3675.3.
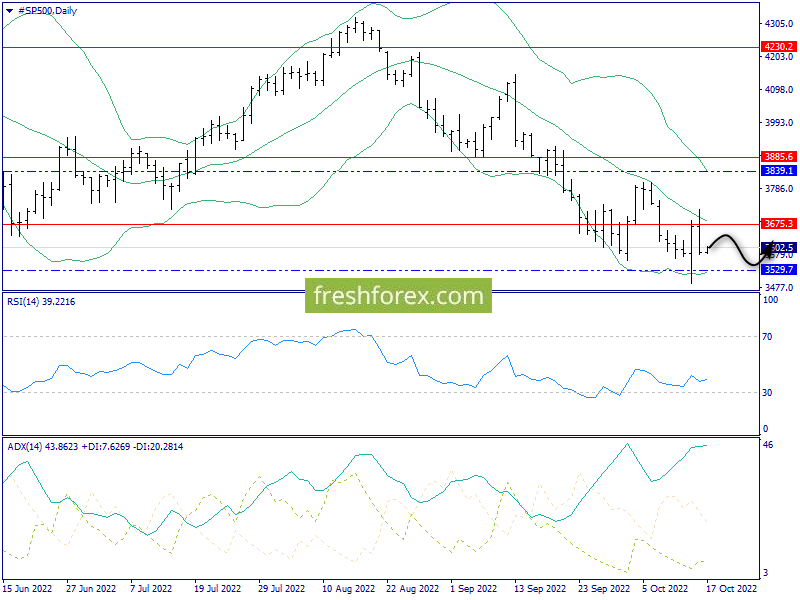
Conclusions : Consolidation in the range 3529.7-3675.3.
Trade decisions : Trade in the range 3529.7-3675.3.
XAUUUSD
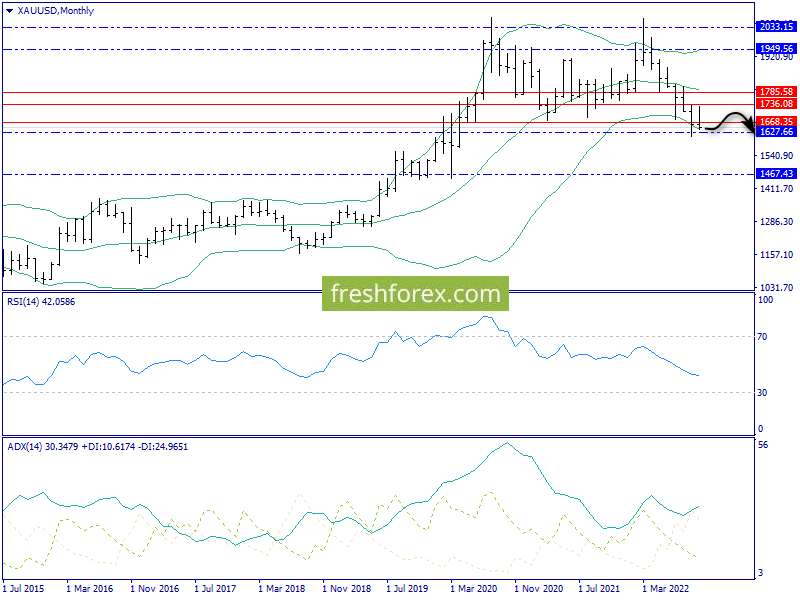
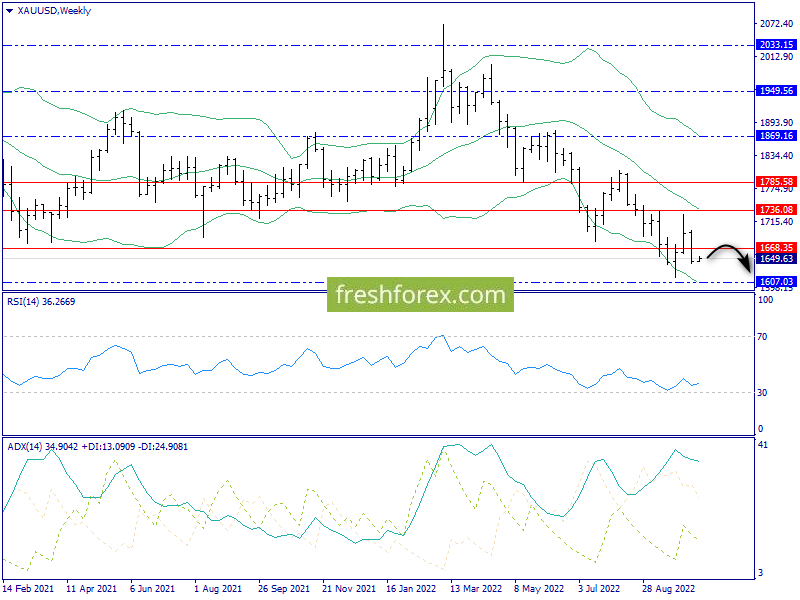
Monthly graph : strong support provides gold to the lower strip of the Bolinger (1627.66), for the breakdown of which has not yet been enough ADX potential. However, he clearly increases.
Weekly schedule : Here the lower line of the Bolinger is located closer to the psychological level of 1600.00, which, which, It will probably be tested.
Day schedule : We also mark the active ADX, therefore, after some proportion within the envelopes of the Bolinger (1612.69-1736.00), the quotes will probably go to 1600.00.
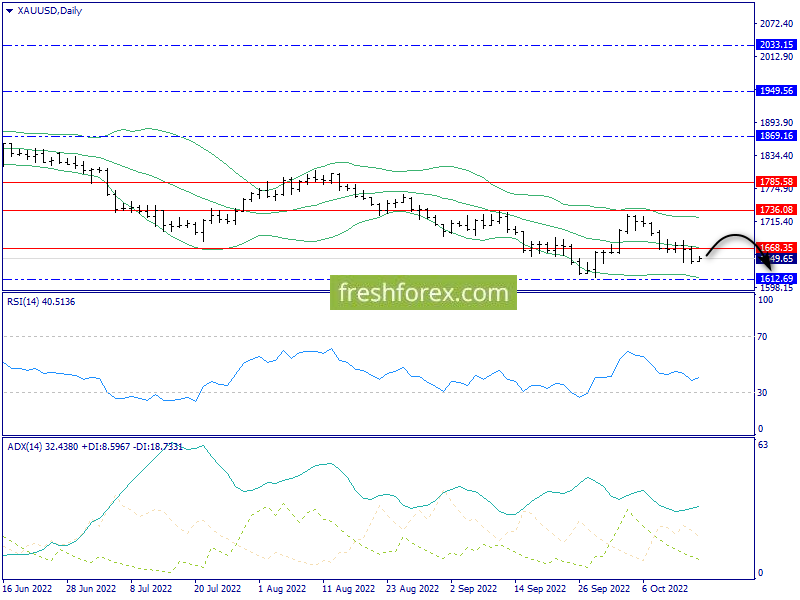
Conclusions : decrease by 1600.00.
Trade decisions : Sales by 1600.00.
Ethereum
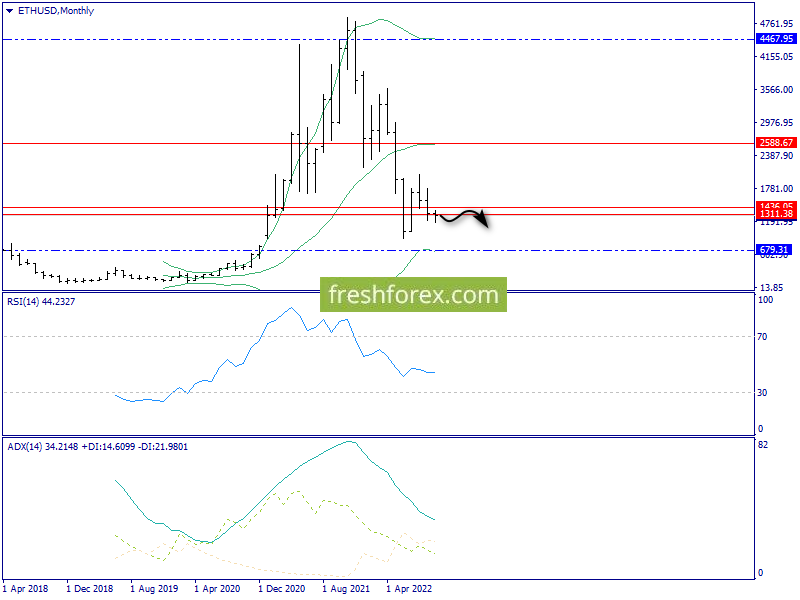
10100 Monthly graph : Flate continues in the field of accumulation of medium lines of the Bolinger with smaller timeframes (1311.38-1436.05).
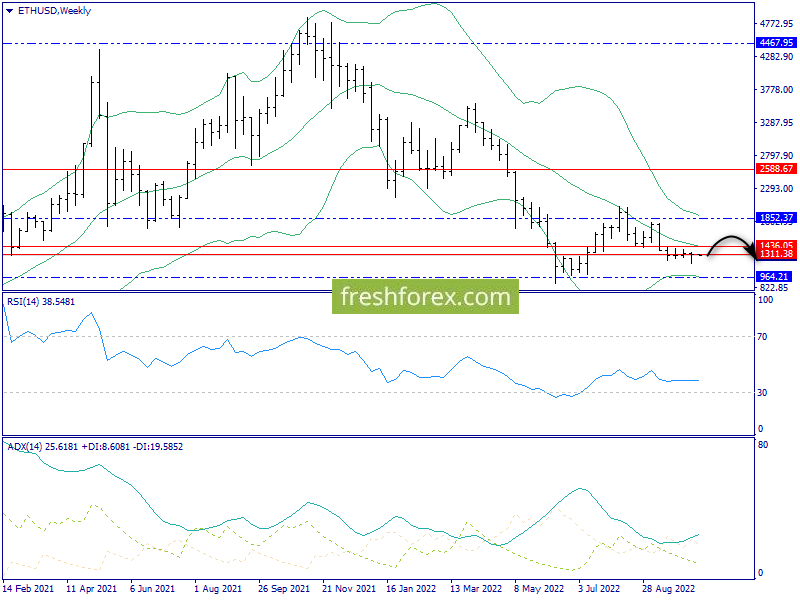
Weekly schedule : Stable envelopes Bolinger and the relatively low trend potential of ADX indicate the likely consolidation of the market in the middle lane of the Bolinger (1436.05).
daily graph : a narrow side corridor inside the envelopes of the Bolinger (1270.60-1365.75). Apparently, quotes will remain in these boundaries.
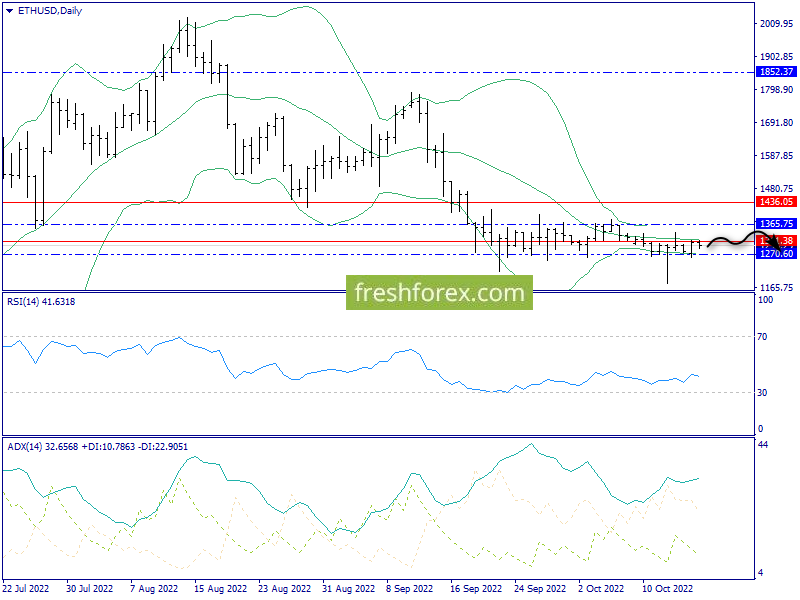
Conclusions : Consolidation in the range 1270.60-1365.75.
Trade decisions : Trade in the range 1270.60-1365.75.