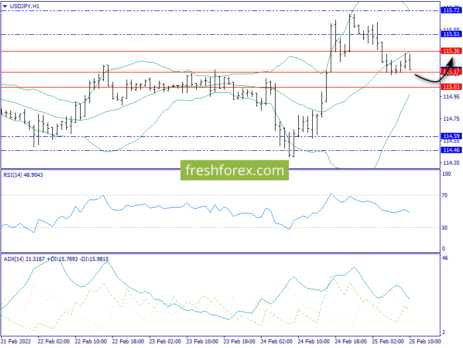
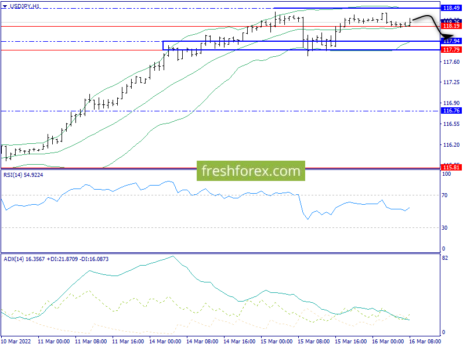
Daily chart: Very high volatility Yesterday did not change the general medium-term picture – the steam remains within the limits of horizontally oriented Bollinger envelopes (114.46-115.87).
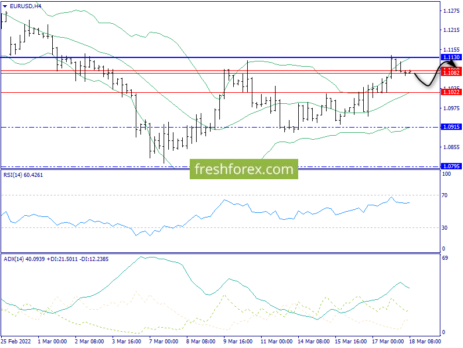
Daily chart : The pair is testing the middle band of the Bollinger (1.1082), where the big interest of sellers can be focused – two weeks ago, the lower envelope of the Bollinger was broken, which is a downward wave signal.
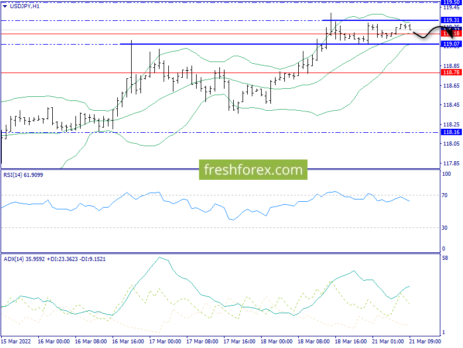
Daily chart: The fourth in a row bar outside the top envelope of the Bollinger is an important feature of a possible transition to downward correction.